Motivating applications
 You can tell a lot about the methods developed by an optimization community by the problems they use to illustrate their models and algorithms.
Computer scientists have long used games and stylized control problems to test out their advances in reinforcement learning.
Our work started by optimizing a fleet of trucks, before transitioning to fleets of locomotives. We have worked on optimal learning in drug discovery and materials science before we tackled optimizing the grid for PJM Interconnections. We did extensive research on a wide range of energy storage problems before starting a company, Optimal Dynamics, to take the research to the entire truckload industry.
It is hard to emphasize the importance of a rich set of motivating applications if you are going to work on general methodology. This is the only way to avoid falling into the trap of creating what appears to be a general strategy for solving stochastic optimization problems, and then illustrating it on a single class of problems.
Click on a project below to jump to a brief description:
- Truckload fleet management for North American Van Lines (1984–1986)
- Real-time dispatching for Burlington Motor Carriers (1990s)
- Locomotive optimization for Norfolk Southern Railway (1996–2008)
- ADP-based truckload fleet simulator for Schneider National (2004–2008)
- Drug discovery (2008–2012)
- Optimal learning in materials science (2008–2014)
- Modeling the PJM grid for high levels of offshore wind (2008–2012)
- Energy storage research (2011–2020)
- Modeling wind and prices (2010–2015)
- Managing clinical trials (2016–2018)
- Optimizing utility trucks after a storm (2016–2018)
- Optimal Dynamics — Optimizing the truckload industry (2017–present)
Truckload fleet management for North American Van Lines (1984–1986)
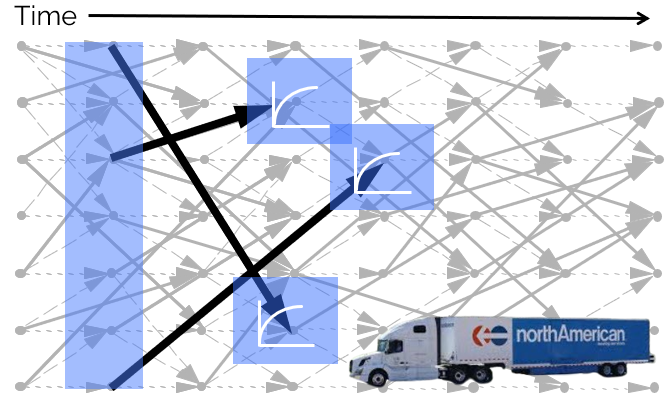 Our first project with a truckload carrier modeled the fleet at an aggregate level (“trucks”) using an early version of what would grow into our work on approximate dynamic programming. This model, called LoadMAP, replaced the early deterministic models of the future (the grey network in the background) with a stochastic model using piecewise-linear value functions. This was the first production model using a stochastic model of future loads. The project was a finalist in the prestigious Franz Edelman competition conducted by Informs.
Real-time dispatching for Burlington Motor Carriers (1990s)
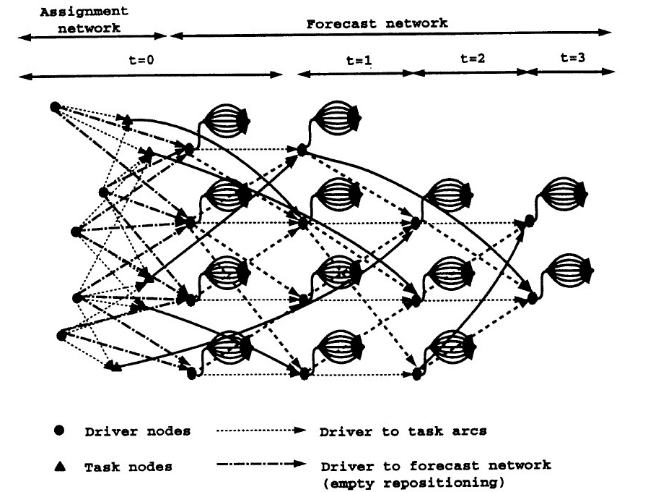 This project modeled each individual driver in the first time period at a high level of detail, making it possible to capture home domicile, truck type, and hours of service. The model, called MicroMAP, was an extension of LoadMAP since it blended a detailed assignment model for the initial dispatch with the nonlinear value-function approximations in the future.
Locomotive optimization for Norfolk Southern Railway (1996–2008)
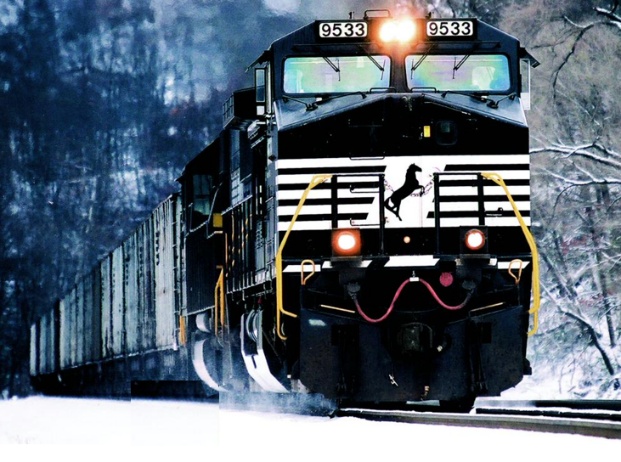 This was our first production implementation of a locomotive planning model based on a formal representation as a dynamic program solved using approximate dynamic programming. The use of ADP allowed us to reduce an intractably large deterministic optimization model to a sequence of much smaller integer programs that could be solved with CPLEX. The model (developed by Belgacem Bouzaiene-Ayari) was called PLASMA (Princeton Locomotive and Shop Management system) and is still running in 2026.
ADP-based truckload fleet simulator for Schneider National (2004–2008)
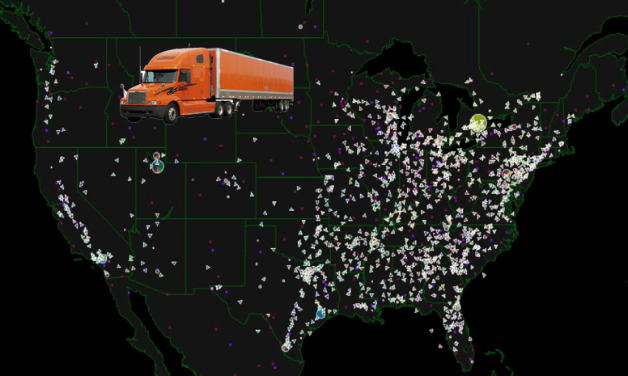 Based on the architecture of the locomotive optimization model, this model used approximate dynamic programming as an “optimizing simulator” to simulate the dispatching of drivers over a month. The goal was to study a wide range of policy decisions such as domiciling strategies and changes in work rules. The model, developed by Hugo Simao, won the Daniel H. Wagner Prize for Excellence in Operations Research Practice in 2009. This model was later licensed to Optimal Dynamics and still forms the foundation of their planning tools.
Drug discovery (2008–2012)
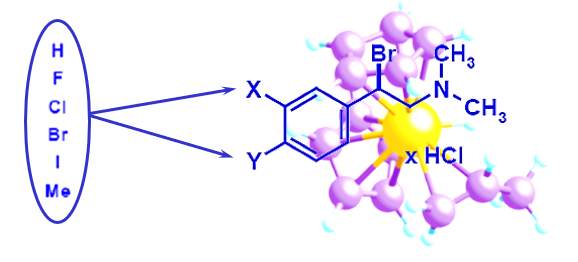 Building on our work in optimal learning, we became involved in the process of drug discovery, which motivated the use of the recently developed knowledge gradient algorithm (by Peter Frazier), which we adapted to problems where beliefs were represented using a linear model. This work was the basis of the senior thesis of Diana Negoescu; the work won an honorable mention in the Doing Good with Good OR competition in 2009.
Optimal learning in materials science (2008–2014)
 Motivated by the “exploration vs. exploitation” problem well known in approximate dynamic programming, we started a research initiative into optimal learning (efficient collection of information) which led to a major AFOSR contract developing optimal learning methods in the context of materials science. This work launched an entirely new set of learning methods motivated by different types of belief models and experimental settings (joint work with Peter Frazier). See the knowledge gradient page for the broader research lineage.
Modeling the PJM grid for high levels of offshore wind (2008–2012)
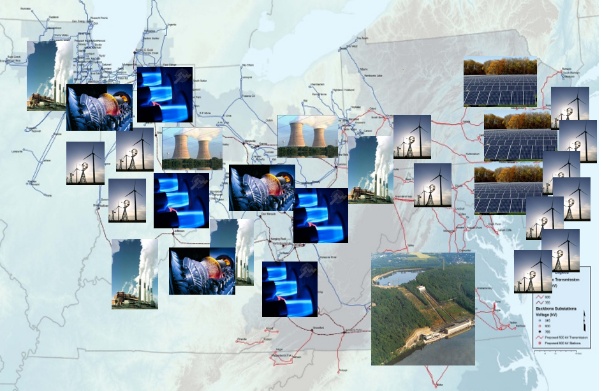 The MAOWIT study (Mid-Atlantic Offshore Wind Interconnection and Transmission), joint with the University of Delaware (funded by DOE), produced a detailed model of the PJM power grid (called SMART-ISO) that allowed us to undertake studies of increasing levels of power from offshore wind turbines. Developed by Hugo Simao, the goal was to model PJM’s planning process at a high level of detail, using a carefully calibrated model of energy from wind. See the SMART-ISO page for a detailed description.
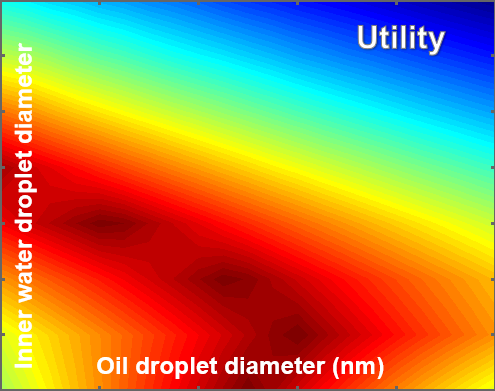
Energy storage research (2011–2020)
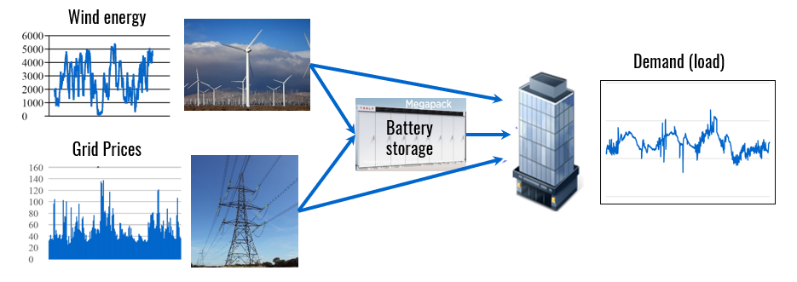 Over a 10-year period I supervised research into a wide range of energy storage problems, with different time scales and configurations. This class of applications posed different modeling challenges (especially in the modeling of uncertainty) and, most important, the need to use all four classes of policies — sometimes on the same configuration (as we did for the figure to the right). One application required the proper (and widely overlooked) problem of handling rolling forecasts, which astonishingly seems to have been overlooked in the inventory literature. This research is reviewed in more depth on the Energy storage research page.
Modeling wind and prices (2010–2015)
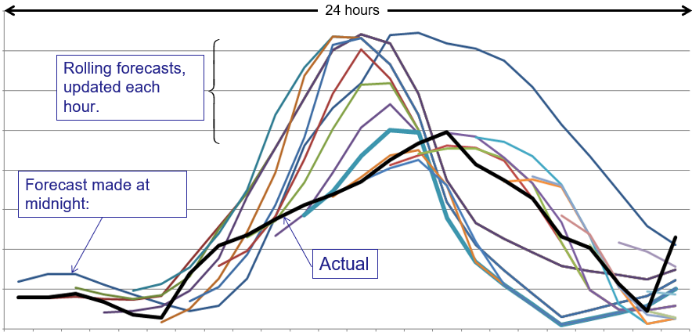 Energy poses complex stochastic prices to capture the volatility of electricity prices and the dynamics of rolling forecasts of wind. Combine these issues with the correlations over space and time on multiple time scales, and you get an appreciation of the difficulty of stochastic modeling. This is described in considerable depth in chapter 10 of Reinforcement Learning and Stochastic Optimization (free PDF).
Managing clinical trials (2016–2018)
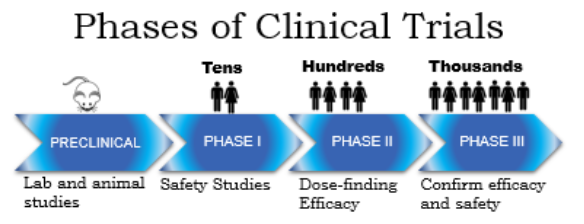 Drug testing involves a variety of sequential decisions, starting with the choice of drug, the choice of disease(s) the drug might be applied to, and the entire process of managing the trial through each of the different phases — a blend of information collection along with the management of significant levels of physical and financial resources. See chapter 14 of Sequential Decision Analytics and Modeling for an illustration of different types of policies for managing the testing process.
Optimizing utility trucks after a storm (2016–2018)
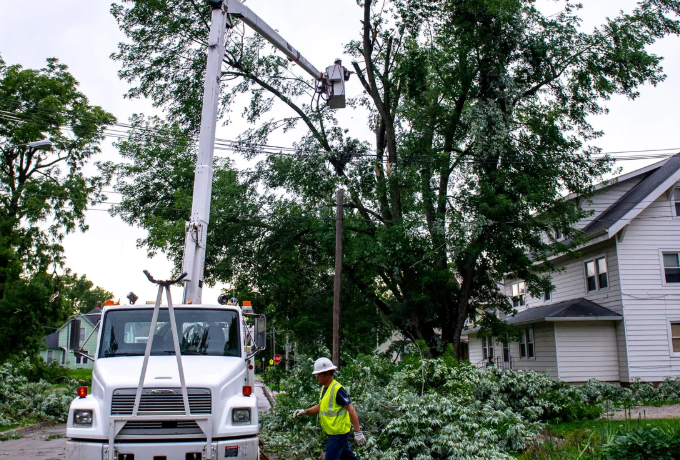 The largest New Jersey utility, PSE&G, gave us the problem of optimizing the routing of utility trucks after a storm. The utility received a series of “lights out” calls from customers who had lost power but had to find where the power lines had been damaged. We modeled it as an information-collecting vehicle routing problem — a sequential decision problem with both a physical state (the status of the truck) and a belief state (where we thought an outage may have happened). See the Information-Collecting Vehicle Routing Problem page for research on this class of problems.
Optimal Dynamics — Optimizing the truckload industry (2017–present)
 In 2017 Optimal Dynamics was founded to bring the work in trucking to industry, which required that we engage in all the dimensions required to make a decision technology successful — spanning data ingestion, decision-making, implementation, and business process change. I wrote a white paper that includes a section on “Designing policies” that illustrates how we are using all four classes of policies. Download the white paper here.